The Category Development Index (CDI) is a powerful tool used to assess the performance of a product category within a specific segment (e.g., geographic area, age group, or socioeconomic group) relative to its average performance across the entire market.
Purpose of the CDI
The CDI is designed to evaluate the attractiveness of a segment for a given product category, independently of any specific brand’s performance. It helps brands identify segments with a strong affinity for their category—even if they are not yet well established in those segments.
CDI Formula
The CDI is calculated using a formula similar to that of the Brand Development Index (BDI):
- CDI > 100 : The segment consumes more of the category than the market average.
- CDI < 100 : The segment consumes less than the market average.
Différence between CDI and BDI
| Indicator | Purpose | Focus |
|---|---|---|
| BDI | Assess a brand’s performance in a segment | Brand vs. market comparison |
| CDI | Assess a category’s performance in a segment | Category vs. market comparison |
They are complementary : a low BDI in a high CDI segment suggests untapped potential for the brand, but the brand is not yet leveraging this potential.
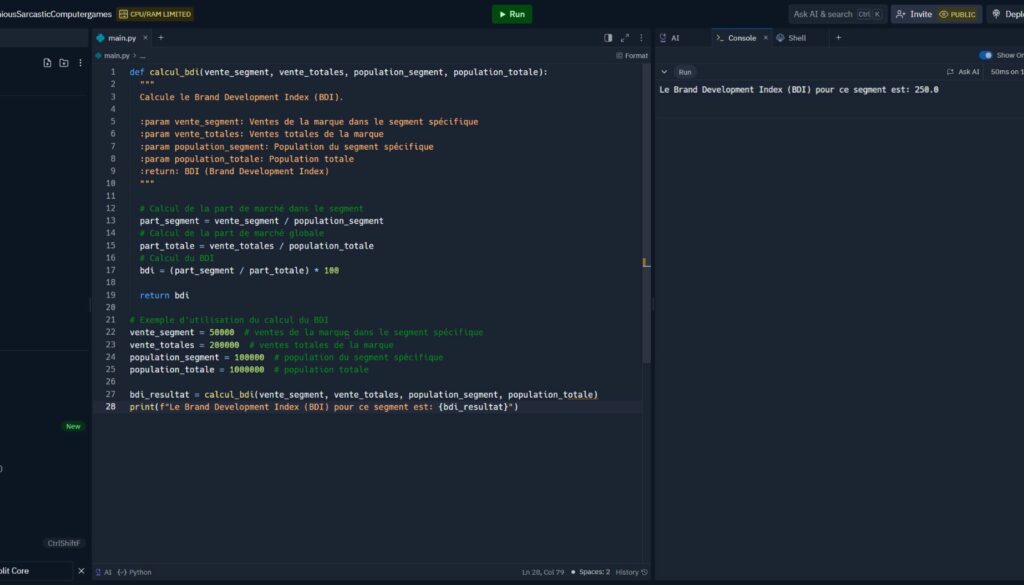
def calcul_cdi(ventes_cat_segment, ventes_cat_totales, population_segment, population_totale):
"""
Calcule le Category Development Index (CDI).

:param ventes_cat_segment: Ventes de la catégorie dans le segment
:param ventes_cat_totales: Ventes totales de la catégorie
:param population_segment: Population du segment
:param population_totale: Population totale
:return: CDI (Category Development Index)
"""
part_segment = ventes_cat_segment / population_segment
part_totale = ventes_cat_totales / population_totale
cdi = (part_segment / part_totale) * 100
return cdi
Formula Explanation
- First, calculate the category’s market share within the segment. Then, calculate the category’s share across the total market.
- The CDI is the ratio of these two shares, multiplied by 100.
- It is a relative index, meaning it is directly interpretable: a CDI of 120 indicates the segment consumes 20% more than the market average.
Result iInterpretation
- CDI = 100 : Consumption is proportional to the population.
- CDI > 100 : Relative overconsumption.
- CDI < 100 : Relative underconsumption.
Example in figures
- Category sales in segment : 60,000 units
- Total category sales : 1,200,000 units
- Segment population: 150,000
- Total population: 3,000,000
resultat = calcul_cdi(60000, 1200000, 150000, 3000000)
print(f"CDI = {resultat:.2f}")
Result: CDI = 100.00 → the segment consumes exactly in line with the national average.
Strategic implications
- High CDI : Strong affinity with the category → growth potential for brands.
- Low CDI : Explore barriers (cultural, economic, logistical) or consider repositioning the offer.
Detailed Python code
import pandas as pd
import matplotlib.pyplot as plt
# -----------------------------
# 1. CDI calculation Function
# -----------------------------
def calcul_cdi(ventes_segment, ventes_totales, pop_segment, pop_totale):
"""
Calculate Category Development Index (CDI).
"""
part_segment = ventes_segment / pop_segment
part_totale = ventes_totales / pop_totale
cdi = (part_segment / part_totale) * 100
return round(cdi, 2)
# -----------------------------
# 2. Simulated data by region
# -----------------------------
data = {
"Région": ["Île-de-France", "PACA", "Bretagne", "Occitanie", "Nouvelle-Aquitaine"],
"Ventes_cat": [120000, 80000, 45000, 70000, 65000],
"Population": [12000000, 5000000, 3500000, 6000000, 5800000]
}
df = pd.DataFrame(data)
# -----------------------------
# 3. Category total calculation
# -----------------------------
ventes_totales = df["Ventes_cat"].sum()
population_totale = df["Population"].sum()
# -----------------------------
# 4. CDI calculation by region
# -----------------------------
df["CDI"] = df.apply(lambda row: calcul_cdi(
row["Ventes_cat"],
ventes_totales,
row["Population"],
population_totale
), axis=1)
print("Données avec CDI calculé :")
print(df)
# -----------------------------
# 5. Visualisation : Bar chart
# -----------------------------
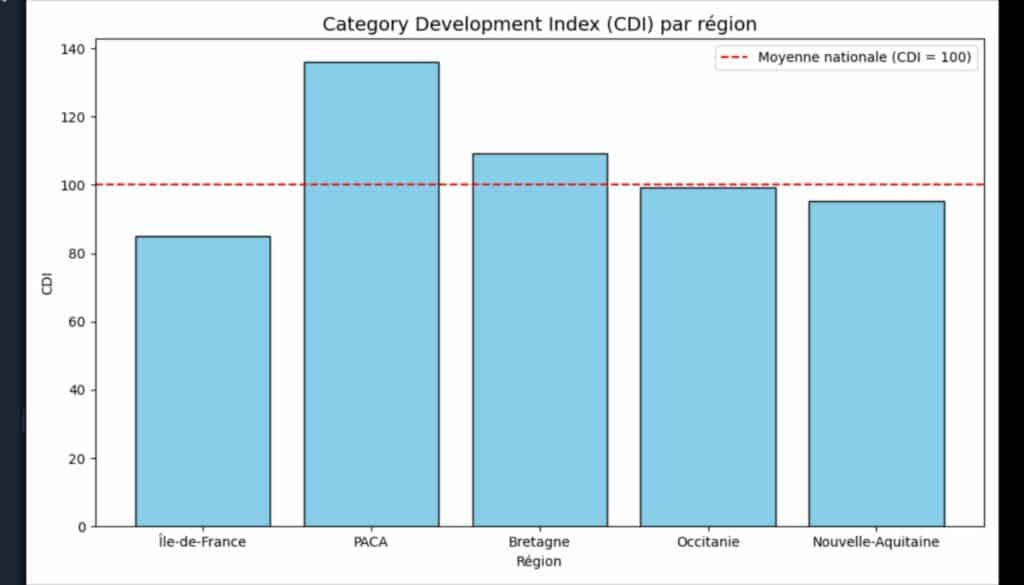
plt.figure(figsize=(10,6))
plt.bar(df["Région"], df["CDI"], color="skyblue", edgecolor="black")
plt.axhline(100, color="red", linestyle="--", label="Moyenne nationale (CDI = 100)")
plt.title("Category Development Index (CDI) par région", fontsize=14)
plt.xlabel("Région")
plt.ylabel("CDI")
plt.legend()
plt.tight_layout()
plt.show()
What this code does :
- Automatically calculates the CDI for multiple regions.
- Displays the results in a Pandas DataFrame.
- Generates a clear graph with the national average (100) as a visual reference.
Combined Use of CDI + BDI
| CDI | BDI | Interpretation | Action |
|---|---|---|---|
| High | High | Key strategic segment | Consolidate, strengthen |
| High | Low | Growth opportunity | Invest, launching campaigns |
| Low | High | Brand loyalty > category appeal | Preserve position |
| Low | Low | Low potential | Reassess presence |
Limitations and considerations
- Inaccurate or outdated data can distort results.
- CDI is an average and may mask internal disparities.
- It indicates consumption potential, not profitability.
Integration into marketing strategy
- Localized go-to-market : Identify priority launch areas.
- Budget prioritization : focus advertising efforts.
- Trade marketing : Adjust assortment for high-affinity areas.
Sector analysis and benchmarks
CDI is particularly useful in sectoral analyses, revealing consumption disparities across geographic or demographic segments. In cosmetics, for example, a high CDI in urban areas may indicate a preference for premium, organic, or tech-enhanced products—often linked to younger, better-informed consumers with higher purchasing power. Brands can then focus on selective channels, digital communication, and in-store activations in these zones.
In food, a high CDI for frozen products in certain regions may reflect specific lifestyles: fast-paced routines, limited access to fresh goods, or a preference for convenience. Such insights enable manufacturers and retailers to consider new store openings or to tailor product ranges accordingly (e.g., more single-serve frozen items in urban centers).
CDI and consumer behavior
CDI is more than a dry performance metric: it reflects entrenched purchasing behaviors shaped by cultural preferences, economic constraints, or social dynamics. For instance, a high CDI for baby products in high-birthrate regions shows a direct link between demographics and consumption. Conversely, a low CDI for tech products in a given area might signal a digital divide or slower innovation adoption. This type of insight helps anticipate needs, tailor advertising, or offer more accessible products.
CDI and geographic targeting
CDI is a valuable tool for localized marketing. In advertising, it highlights where to intensify targeted campaigns (local radio, billboards, geo-targeted SEA). In retail, high-CDI areas may justify increased shelf space or product listings, while low-CDI zones may benefit from repositioning efforts, consumer education, or promotional strategies. For physical (stores, showrooms) or digital rollouts (e-commerce delivery zones, local marketplace campaigns), CDI helps prioritize areas with higher potential ROI.
CDI in an international context
Internationally, CDI enables comparisons of market maturity for a given category. For instance, plant-based beverages may have a high CDI in Scandinavia and a low one in Eastern Europe—reflecting local eating habits, nutrition awareness, or cultural influences. This gap guides the adaptation of global marketing campaigns in tone and message. CDI also helps identify underdeveloped but promising markets, spotting segments where consumption is still low despite a significant target population—opening the door to organic growth opportunities.
Automation and visualization tools
With tools like Python, CDI calculation can be automated at scale using libraries such as pandas for data handling and matplotlib or seaborn for visualization. This enables the generation of CDI scores for hundreds of segments at the click of a button. For more strategic and visual analysis, platforms like Power BI or Tableau offer regional heatmaps and interactive dashboards. Google Data Studio also allows real-time integration of CDI data into dynamic, localized marketing campaigns—providing an ongoing, operational view of market potential.
The Category Development Index (CDI) is more than a statistical indicator—it’s a strategic compass. It highlights high-potential zones, uncovers invisible consumption habits, and aligns marketing investments with on-the-ground realities. By pinpointing where category consumption is highest (or lowest), it serves as a powerful lever to adjust distribution strategy, refine communication, and detect dormant markets with high potential. When combined with other metrics like the BDI, it becomes an essential tool for every marketing decision-maker.
Key takeaways
- CDI measures a segment’s attractiveness for a product category, independent of brand performance.
- A CDI > 100 indicates relative overconsumption ; a CDI < 100, indicates underconsumption.
- Used alone, CDI gauges overall demand; combined with BDI, it reveals brand development opportunities.
- It helps allocate marketing budgets, define priority areas, adapt product offerings, and improve targeting.
- Tools like Python, Power BI, or Tableau enable dynamic CDI tracking within strategic dashboards.